Data Visualization
Stack Rank Cutoff
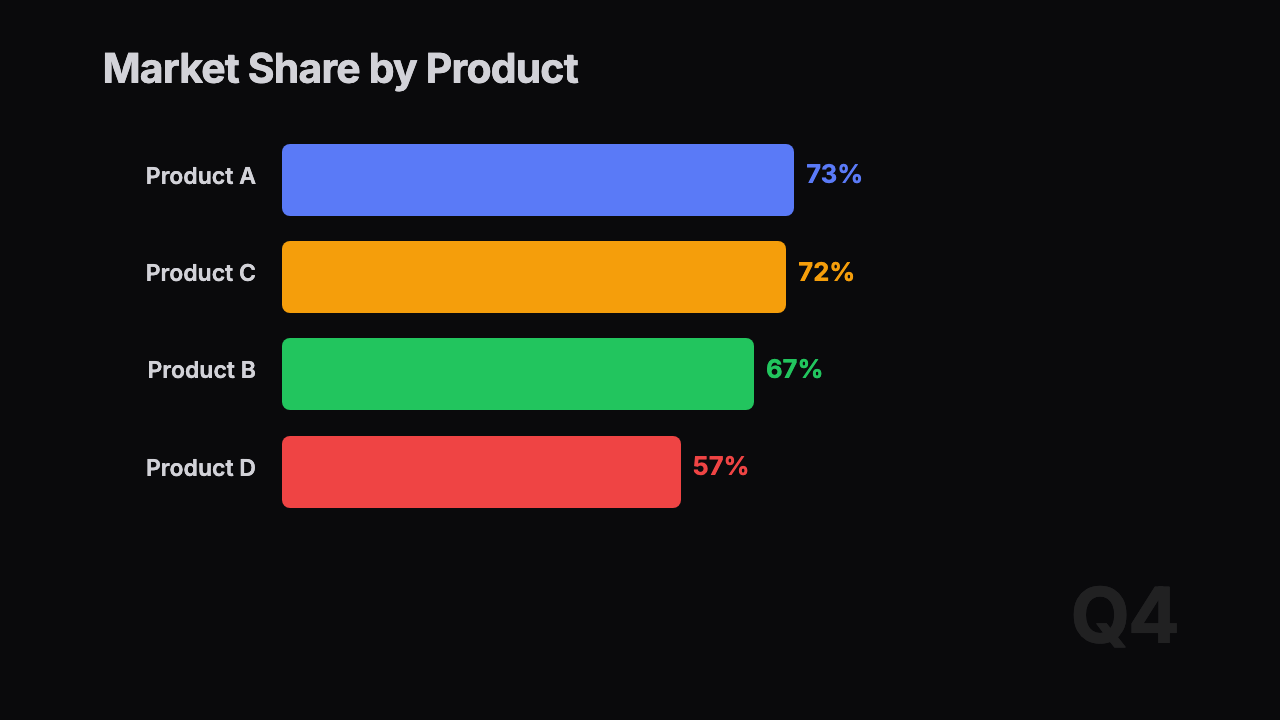
Ranked options build into a scoreboard, then a cutoff line slices the list into selected and below-the-line choices.
Use cases
- —Explain why only the highest-ranked options are selected
- —Show feature prioritization with a budget cutoff
- —Visualize hiring, grants, admissions, or award shortlists
Tags
leaderboardstack rankcutoffprioritizationscoreboardselectiontop choicesthresholdcomparisondecisiontablebarbusinesshiringproducteducationdata visualization
Palette
Related styles
More animations in Data Visualization.